

webDICE
/An online simulation of the economics of climate change.
Read MoreAn online simulation of the economics of climate change.
Read MoreThe major policy instruments for mitigating climate change actually in use in the U.S. are subsidies provided to renewable energy. A popular means of subsidy is through state-level Renewable Portfolio Standards (RPSs), requirements enacted by many states that require a certain fraction of electricity must be derived from renewables. However, many state RPSs are infeasible because of “cost cap” provisions that do not permit renewables to be sufficiently competitive, and feasibility is generally not assessed before legislation is passed. The RPS calculator allows the user to explore the conditions for RPS success or failure in different states. The user can analyze and modify existing state statutes or design new statutes in states that do not have them. Users can explore the effects of parameters such as electricity prices, generation costs for wind and solar, interest rates, technology carveouts, and cost cap structure. Features under development include extension to all U.S. states (currently only IL and CA) and spatial variation in wind speed (wind capacity factor map).

Photo Credit: R.Gustafson / USAID
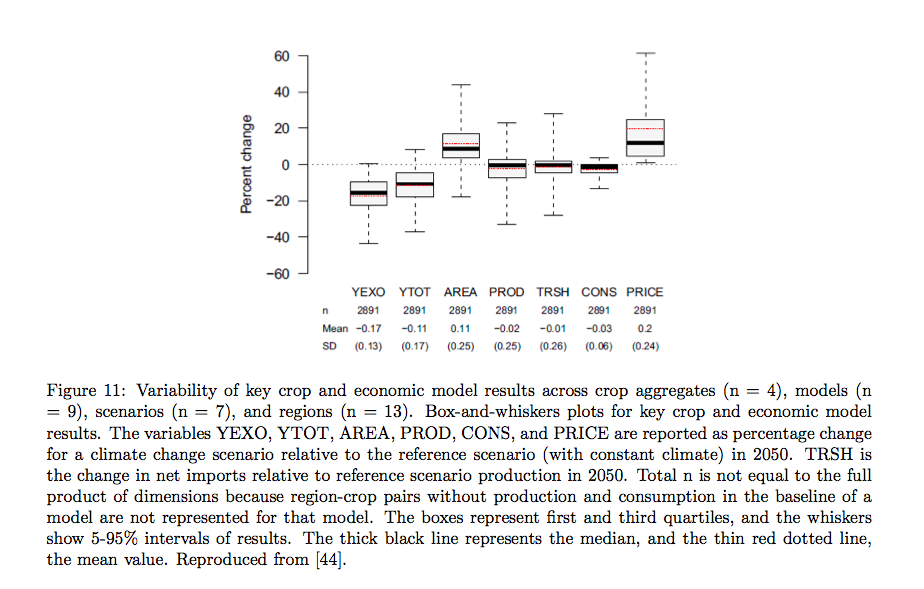
The impact of climate change on future crop production will depend on the impact on mean yields and on the incidence and scale of extreme outcomes. More frequent droughts, heatwaves, and floods due to climate change could severely disrupt the world's food supply. We are participating in an international scientific task force on extreme weather and global food system resilience. The goal is to assess the impact of extreme weather upon the global food chain and offers recommendations on how to mitigate the potential damage from future crises.
The task for has released its findings in a new report. The report assessed the impact of extreme weather upon the global food chain and offers recommendations on how to mitigate the potential damage from future crises.
Our research on "once-in-a-century" food threats -- which we found may become as frequent as once every decade by the 22nd century -- is a prominent feature of the report's warnings, which additionally highlight the concentration of the world's most important crops (maize, soybeans, wheat, and rice) in very few countries, which could exacerbate the damage if extreme weather hits one or more of these regions. An increasingly global market for agricultural products offers protection against small, local food shortages, but may actually increase vulnerability for global shocks, the report also concludes.
“It is likely that the effects of climate change will be felt most strongly through the increasing frequency of extreme weather events such as droughts, heatwaves and floods and their impact on the production and distribution of food – something we almost take for granted," said Professor Tim Benton of the Global Food Security program, in a news release on the report. “This study presents a plausible scenario for how the food system might be impacted by extreme weather, alongside a series of recommendations that should help policy and business plan for the future. Action is urgently needed to understand risks better, improve the resilience of the global food system to weather-related shocks and to mitigate their impact on people.”
Recommendations in the primary report include more research to understand the risks and "worst case scenarios" of future extreme weather, improved coordination between governments on how to handle such food supply shocks, improving the resilience of international markets, and adapting agriculture to expected climate change to protect crops.

Distributions of global calorie-weighted yield of maize, soy, wheat, and rice for the historical (1951-2010) and near-future (2011-2040) period with (top) and without (bottom) the effects of fertilization from increasing atmospheric CO2 included. The estimated magnitude of a 1-in-200 year event in each period is indicated.
In addition to the primary findings, we also co-authored "Annex A" of the report, which focused on Climate and Global Food Production Shocks. We studied the relationship between weather and historical food production shocks (such as the "Dust Bowl" drought of the 1930s), then used crop-climate models to simulate present-day or near-future extreme events.
The report highlights the extreme concentration of certain globally-important crops. For example, almost 60% of the world's maize is grown in the United States and China. For soybeans, 80% of the global supply is farmed in just three countries: the U.S., Brazil, and Argentina. A severe drought in any of these countries, even if it only decreases crop production by 10%, would likely have dramatic consequences for the rest of the world. However high-resolution climate model runs are needed to better quantify the risk of extreme events and food shocks.
Phase II of this project launches in Fall 2015 and will focus on multiple bread-basket failure.
For more on the report, see news stories in The New York Times, Science, The Guardian, and BBC.
People
Joshua Elliott | Michael Glotter | David Kelly | James Chryssanthacopoulos
Publications
The Community Integrated Model for Energy and Resource Trajectories for Humankind (CIM-EARTH) is an open-source modeling framework that allows for the easy specification of computable general equilibrium models, running the resulting simulations, and analyzing the results. This framework is meant to increase both the quality and transparency of integrated assessment modeling by providing open source modeling tools that incorporate the most modern computational methods.
Frameworks:
The AMPL-Source CIM-EARTH Framework (ASCEF) is a first version of the CIM-EARTH framework.
To facilitate adoption and the integration of advanced data processing and analysis services, we undertook an effort to move the implementation from AMPL to C++ and to adopt standard input and output formats. The result is what we call the Open-Source CIM-EARTH Framework (OSCEF).
Models:
CE-Trade: The trade model is used for studying the impacts on international trade of policies relevant to carbon mitigation. In particular, this model is used to assess carbon leakage and mechanisms such as border tax adjustments to reduce leakage.
CE-Energy: The energy model expands core capabilities of CIM-EARTH in order to represent the energy sector in ways more appropriate for policy analysis> The model disaggregated the representation of the U.S. electric power system to include renewable and non-renewable sources, peak and base-load power, and transmission.
CE-Bio: The bio model simulates the economics and lifecycle of biofuel production and use, including a detailed representation of the biofuels market, agriculture, and related services.
CE-Life: The distributional impacts model disaggregates the US consumers in the CE-Trade model by income and age, resulting in a model with 720 distinct consumers.
Structure of the production functions in the baseline CE model:

NOTE: Each node represents a production function. Nodes with vertical line inputs use Leontief functions; the other nodes are labeled with their elasticities of substitution. Table 2 shows the elasticities of substitution between domestic and imported commodities and the Armington international trade elasticities.
Studies:
Unilateral carbon taxes, border adjustments, and carbon leakage.
Analytical general equilibrium effects of energy policy on output and factor prices.
Modeling of Land-Use Changes and Other Indirect Effects of Biofuel Production in CIM-EARTH.
Impact on US Gasoline Prices of Eliminating Biofuels Production: An Equilibrium Analysis
People
Fernando Perez Cervantes | Sou Cheng Choi | Joshua Elliott | Ian Foster | Don Fullerton | Kenneth Judd | Gita Khun Jush | Samuel Kortum | Margaret Loudermilk | Elisabeth Moyer | Todd Munson | Nirupama Rao | David Weisbach
Publications
To characterize climate change impacts in long range simulations using economic and Integrated Assessment (IA) models, we are also developing statistical emulators (i.e. response functions) that map from inputs (e.g. irrigation and fertilizer application) and atmospheric conditions (e.g. atmospheric CO2 and regional temperature and precipitation measures) to agricultural productivity measures at a variety of scales. We are developing a number of aggregation and scaling methodologies to translate high-resolution gridded products to decision-relevant environmental and political scales (e.g. county, watershed, or national boundaries). These methodologies must be versatile enough to map vulnerability, impact, and adaptation (VIA) measures to arbitrary spatial scales, while consistently tracking ensemble uncertainty information throughout.
The emulation tool provides statistical representations of the behaviors of a number of general circulation models (GCMs) from different research groups. The emulator is designed to mimic how the larger models would have responded, and can provide projections of regional temperatures for any user-chosen scenario of future CO2 concentrations.
The emulator is ‘trained’ on publicly-available model simulations of scenarios specified for the IPCC 5th Assessment Report. Users can explore emulated model responses to three IPCC scenarios (RCPs 2.6, 4.5, and 8.5) and one scenario of continuous exponential growth in CO2. Users can also upload their own CO2 scenarios.

Projecting temperature change

Comparing regions
SCREENSHOTS OF THE CLIMATE EMULATOR TOOL
Statistical emulation of climate model output involves using a ‘training set’ of simulations for each model to fit the parameters of a simple statistical model that describes the climate response to changing CO2 concentrations. In the tool here, each region is fit separately.

Radiative forcing associated with the different RCP scenarios. RCP 8.5 represents 'business-as-usual'. Click here for further description
The training set used is archived GCM simulations made as part of the Coupled Model Intercomparison Project 5 (CMIP5), and archived at the Earth Systems Grid database (available from various sites, including here or here). The simulations use CO2 scenarios developed for the Intergovernmental Panel on Climate Change 5th Assessment Report. These ‘Representative Concentration Pathways’, or RCPs, describe the CO2 concentrations associated with various potential emissions scenarios (see graphic on the left). Where available, we use RCP 4.5, RCP 6.0, and RCP 8.5 as the training set. For some models that did not archive all scenarios, we use only RCP 4.5 and RCP 8.5.
The statistical model used for emulation is described in detail in Castruccio et al 2013
People: Alison Brizius | Nathan Matteson | Elisabeth Moyer | Aidan Sadowski | Michael Stein
Alumni: Stefano Castruccio | Bill Leeds | John Moosemiller | Grant Wilder
The consequences of climate change are most often depicted as acts of nature: warmer temperatures, rising sea levels, and more frequent extreme weather. But a shifting climate will also dramatically affect civilization’s oldest industry, agriculture. More and more scientists are focusing their attention on how climate change will affect crop yield, farming practices, and food security for the world, and the massive implications for economics and health. Research on these important topics by Joshua Elliott of RDCEP is heavily featured in “Climate Change and Food Systems,” a new, free-to-download book published by the Food and Agriculture Organization (FAO) of the United Nations.
The primary mission of FAO is to improve food security around the world, by reducing hunger and poverty while protecting natural resources. But all of these goals are moving targets in light of climate change and its uncertain downstream effects upon global supplies of food and water. In her foreword to the new book, FAO Deputy Director-General Natural Resources Maria Helena Semedo wrote that the response to these changes must come from several quarters.
“The growing threat of climate change to the global food supply, and the challenges it poses for food security and nutrition, requires urgent concerted policy responses and the deployment of all the scientific knowledge and accumulated evidence at our disposal,” Semedo said. “It also requires a sharper focus on the important drivers of climate adaptation, including the potential role of trade to mitigate some of the negative impacts of climate change on global food production.”
Elliott’s two chapters in the book demonstrate the current state and potential of computational modeling to anticipate and prepare for these challenges. By connecting advanced climate models and their outputs to agricultural and economic models, researchers can make robust forecasts of how climate change will affect food supplies -- and vice versa. For example, shifting dietary preferences in the developing world could lead to changes in planting practices or more livestock farming, further elevating atmospheric carbon and accelerating climate change.
Modeling can also help policymakers and scientists understand the regional relationship between climate and food systems. While areas near the equator will likely become less amenable to agriculture in a warmer, drier future, areas far North or South may grow more hospitable to crops. Some regions may also experience a form of “hidden hunger” -- decreased nutritional value from staple crops such as wheat and rice that contain less vitamins and protein when grown in a high-CO2 atmosphere.
These forecasts can also inform potential policies that help society adapt or mitigate the damage of climate change. New trade policies, for instance, may help alleviate food security concerns from the drift of food production to regions farther away from the equator. Modeling studies may also provide informed guidance for issues such as water supply management and the use of agricultural biotechnology, biofuels, and fertilizer.
“This book brings together some of the world’s leading experts in climate change and food systems to produce a comprehensive report on the state of modeling and science around these issues,” Elliott said. “For almost 70 years, the FAO has been a major driving force for improving global agriculture, food security, and human health. With the credibility and scope that FAO brings to this debate, I hope this exciting and comprehensive book can help drive the conversation about global change in the coming decades, and inspire an increased focus on food security and climate change adaptation, as well as a renewed call to researchers and modelers to address these essential topics. “
For more on “Climate Change and Food Systems,” see the UN FAO release.
People
Publications
SOLE is a reproducible framework that consists of several tools for engaging researchers in reproducible research.
Read MoreSummary of study:
Freshwater availability is relevant to almost all socioeconomic and environmental impacts of climate and demographic change and their implications for sustainability. We compare ensembles of water supply and demand projections driven by ensemble output from five global climate models. Our results suggest reasons for concern. Direct climate impacts to maize, soybean, wheat, and rice involve losses of 400-2,600 Pcal (8-43% of present-day total). Freshwater limitations in some heavily irrigated regions could necessitate reversion of 20-60 Mha of cropland from irrigated to rainfed management, and a further loss of 600-2,900 Pcal. Freshwater abundance in other regions could help ameliorate these losses, but substantial investment in infrastructure would be required. Models project that direct climate impacts to maize, soybean, wheat, and rice involve losses of 400-1,400 Pcal (8-24% of present-day total) when CO2 fertilization effects are accounted for or 1,400-2,600 Pcal (24-43%) otherwise.
Neil Best | Joshua Elliott | Ian Foster | Michael Glotter
Delphine Deryng | Alex C. Ruane | Christian Folberth | Christoph Muller | Thomas A. M. Pugh | Erwin Schmid | Kenneth Boote | Dieter Gerten | James W. Jones | Stefan Olin | Sibyll Schaphoff | Hong Yang | Katja Frieler | Markus Konzmann
Flrke M, Wada Y, Eisner S, Fekete BM, Gosling SN, Haddeland I, Khabarov N, Ludwig F, Masaki Y, Olin S, Cynthia Rosenzweig, Satoh Y, Schmid E, Stacke T, Tang Q, Wisser D.
Deryng D, Elliott J, Ruane A, Folberth C, Muller C, Pugh T, Schmid E, Boote K, Gerten D, Jones J, Olin S, Schaphoff S, Yang H, Rosenzweig C. Disentangling uncertainties in future crop water productivity under climate change? Submitted to PNAS ISI-MIP special issue, January 2013.
Elliott J, Deryng D, Muller C, Frieler K, Konzmann M, Gerten D, Glotter M, Flrke M, Wada Y, Best N, Eisner S, Fekete BM, Folberth C, Foster I, Gosling SN, Haddeland I, Khabarov N, Ludwig F, Masaki Y, Olin S, Rosenzweig C, Ruane AC, Satoh Y, Schmid E, Stacke T, Tang Q, Wisser D. Constraints and potentials of future irrigation water availability on agricultural production under climate change. Proceedings of the National Academy of Sciences, 2014 ;111(9):3239–3244.
A suite of tools, data, and models developed to facilitate access to high-resolution climate impact modeling
Read More
The Agricultural Model Intercomparison and Improvement Project (AgMIP) is a major international effort linking the climate, crop, and economic modeling communities with cutting-edge information technology to produce improved crop and economic models and the next generation of climate impact projections for the agricultural sector.
The goals of AgMIP are to improve substantially the characterization of world food security due to climate change and to enhance adaptation capacity in both developing and developed countries. Analyses of the agricultural impacts of climate variability and change require a transdisciplinary effort to consistently link state-of-the-art climate scenarios to crop and economic models. Crop model outputs are aggregated as inputs to regional and global economic models to determine regional vulnerabilities, changes in comparative advantage, price effects, and potential adaptation strategies in the agricultural sector. Climate, crop model, economics, and information technology protocols are presented to guide coordinated AgMIP research activities around the world, along with cross-cutting themes that address aggregation, uncertainty, and the development of Representative Agricultural Pathways (RAPs) to enable testing of climate change adaptations in the context of other global trends.
The Coordination Team is led by Joshua Elliott and Christoph Müller and welcomes questions, comments, requests, ideas, project proposals, or criticisms and can be contacted here.
People
Publications
US forests have been a net carbon sink for the past 50 years, sequestering 500–800 million tons of CO2 per year for the past 20 years. This sequestration has benefited the global climate system, offsetting 10–15% of gross GHG emissions in the US. Recent projections from the US Forest Service, however, suggest that the ability of US forests to sequester carbon may be imperiled over the coming decades, in part due to adverse climate impacts on forests, as well as the expansion of cropland. While there is nascent research into the future capacity of forest carbon sinks, many analyses either do not incorporate market responses to biophysical shocks; are static, failing to account for dynamic adjustments in harvest schedules or investments; do not address climate change, which will likely cause increased forest disturbance; or are deterministic and ignore the impact of future uncertainty on optimal decision making in the presence of significant irreversibilities and risk aversion.

vegetation projections (a) Mci-modeled potential vegetation under observed 1961-1990 cliamte. (b) mci-modeled potential vegetation under projected 2071-2100 climate where any of nine general circulation model-emissions scenario combinations projects a change. biomes, in (a) and (B), from poles to equator: ice (ic), tundra and alpine (UA), boreal conifer forest (bc), temperate conifer forest (TC), temperate broadleaf forest (tb), temperate mixed forest (tm), temperate shrubland (ts), temperate grassland (tg), desert (de), tropical grassland (rg), Tropical woodland (rw), tropical deciduous broadleaf forest (rd), and tropical everygreen Broadleaf forest (re). (c) confidence of biome projections calculated from fraction of general circulation model-emissions scenario combinations that project the same time of biome change.
In a new project, we're extending the FABLE (Forest, Agriculture, and Biofuels in a Land use model with Environmental services) model to more accurately capture forestry management decisions. Forests are managed differently in different regions from intensive management in plantations forests to continued old growth extraction in boreal zones to selective logging with significant collateral damage in the tropics. Over 60% of the world’s timber harvests occur in temperate and boreal zones, which may experience increased forest fire activity. Adapting management to rising forest fire probabilities, or extreme fire seasons, could affect global prices and consequently management in the fast-growing plantation regions of the subtropics. Disaggregating FABLE by ecological zones will account for factors such as forestry rotations, management intensity, and the development of fast-growing plantations.
Further, we plan to use a dynamic global vegetation models to estimate uncertainties in timber yields due to climate change. Impacts from climate change will differ substantially by region. Boreal zones are expected to experience the largest shocks, although the species in the tropics are potentially the least adaptive and are more susceptible to smaller shocks. We will model natural disturbances due to forest fires as shocks to forest stocks, using the MC1 dynamic global vegetation model for these estimations. The change in timber yields will be assumed to be proportional to changes in net primary productivity projected by the MC1 model.
We will also incorporate improved estimates of land use change and land availability. Changes in the potential area of land available for forests to grow will be assumed to be proportional to changes in the ecological zones produced by MC1. While MC1 may predict a large increase or decrease in the area of particular species, the actual area of the species will be a function of economic conditions and crop yields.
People:
Yongyang Cai | Alla Golub | Thomas Hertel | Kenneth Judd | Brent Sohngen | Jevgenijs Steinbuks
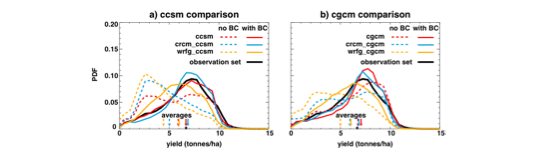
Dssat probability distributions of 1980-1998 rain-fed maize yield driven by all climate products. a and b show yields driven by ccsm and cgcm output, respectively. observation-driven yield distributions are duplicated in both panels (black line) and mapped on right (time-averages, with outline demarking the corn belt, counties with ≥ 1/4 land cultivated with maize). Aggregation is by county and not normalized for size or total yield. Arrows and star in a and b show average county yiled. yields driven by non-bias-corrected inputs (dashed) are generally skewed low, with the skew worse for dynamical downscaling than for simply interpolated gcm inputs. Bias-correcting climate inputs (solid) largely eliminates distributional discrepancies against the observation set.
Interest in estimating the potential socioeconomic costs of climate change has led to increasing use of dynamical downscaling: nested modeling in which regional climate models (RCMs) are driven with general circulation model (GCM) output to produce fine-spatial-scale climate projections for impacts assessments. We evaluate here whether this computationally intensive approach significantly alters projections of food supply. Our results suggest that it does not. We simulate U.S. maize yields with the widely-used DSSAT crop model, driven by two GCMs, each in turn downscaled by two RCMs. While RCMs correct some GCM biases related to fine-scale geographic features, errors in yield are dominated by broad-scale (100s of kms) GCM systematic errors that RCMs cannot compensate for. Once a simple statistical bias correction is applied, GCM- and RCM-driven U.S. maize yields are essentially indistinguishable. These results support previous suggestions that the benefits for impacts assessments of dynamically downscaling raw GCM output may not be sufficient to justify its computational demands.
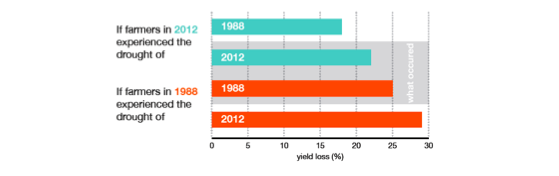
Comparison of the productivity effects of drought over time by evaluation of the 1988 and 2012 droughts and historical counterfactuals.
Current: Joshua Elliott | Ian Foster | Michael Glotter | Elisabeth Moyer
Alumni: Neil Best
Global land use research to date has focused on quantifying uncertainty effects of three major drivers affecting competition for land: the uncertainty in energy and climate policies affecting competition between food and biofuels, the uncertainty of climate impacts on agriculture and forestry, and the uncertainty in the underlying technological progress driving efficiency of food, bioenergy and timber production. The market uncertainty in fossil fuel prices has received relatively less attention in the global land use literature. Petroleum and natural gas prices affect both the competitiveness of biofuels and the cost of nitrogen fertilizers. High prices put significant pressure on global land supply and greenhouse gas emissions from terrestrial systems, while low prices can moderate demands for cropland. In this study, we assessed and compared the effects of these core uncertainties on the optimal profile for global land use and land-based GHG emissions over the coming century. FABLE integrates distinct strands of agronomic, biophysical and economic literature into a single, intertemporally consistent, analytical framework, at global scale. Our analysis accounted for the value of land-based services in the production of food, first- and second-generation biofuels, timber, forest carbon and biodiversity.
We have modeled uncertainty in future fossil fuel prices with discrete time, discrete state-space, time-homogenous Markov chain methods. The stochastic process is characterized by a state space and transition matrix describing the probabilities of particular transitions. The states represent whether world is on high, middle (reference path), or low price paths in a given time period. In our modeling, these are exogenous states because we will be using price data provided by EIA and extrapolated into the future.
We found that by mid-century, slowing population growth, coupled with ongoing agricultural productivity growth will likely bring an end to large scale cropland conversion, after which point the worlds land resources will likely become a net carbon sink. There is great uncertainty about the allocation of the worlds land resources in 2100. We have compared the land use impacts of anticipated uncertainty in climate impacts, climate regulation and energy prices and find that energy prices are the most significant source of uncertainty in global land use in 2100. High energy prices encourage more land conversion for biofuels and raise the cost of cropland intensification, while low energy prices have the opposite effect.
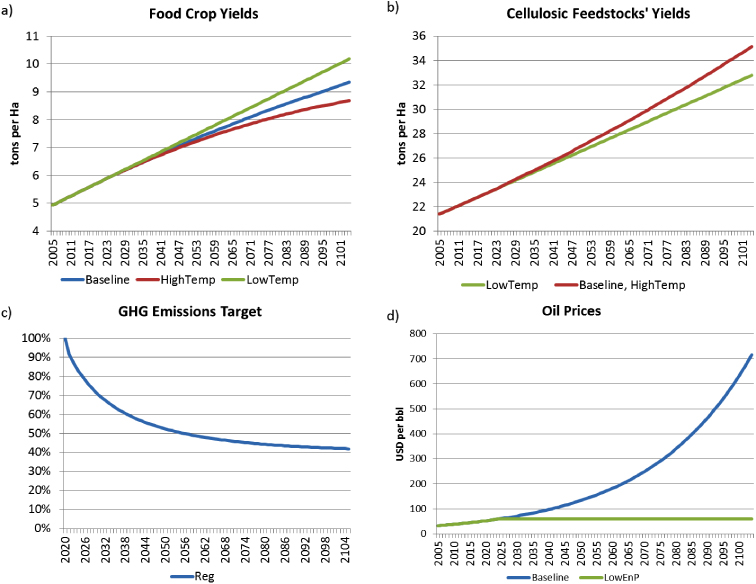
Model scenarios. Panels (a) and (b) pertain to climate change impacts. Panel (c) pertains to GHG regulatory scenario and panel (d) shows energy price scenarios.
The Inter-Sectoral Impact Model Intercomparison Project uses a community-driven modeling effort in order to bring together impact models across sectors and scales for creating consistent and comprehensive projections of the impacts of different levels of global warming. The goal is to provide cross-sectoral global impact assessments, which is based on the Representative Concentration Pathways (RCPs) and Shared Socio-Economic Pathways (SSPs) scenarios. Based on these common background scenarios, a quantitative estimate of impacts using policy-relevant and society-focused metrics, and uncertainties for different sectors and from multiple impact models will be derived.
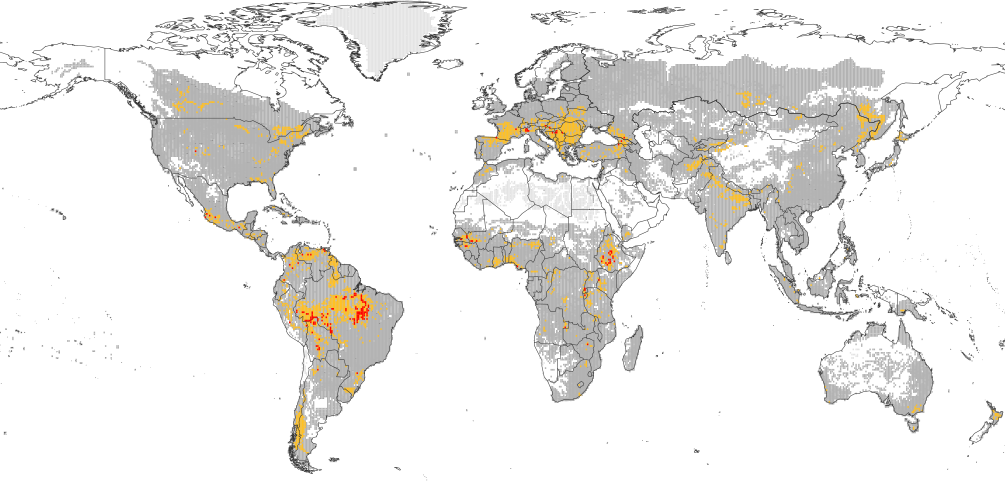
Hotspots where severe impacts are experienced in two (orange) and three (red) overlapping sectors.
Studies of mitigation pathways and strategies show that limiting global warming to 2° is much more ambitious and costly than a 3°. However, little is known of the quantitative differences between impacts of different levels of global warming, not to mention how impacts in different may interact and potentially amplify one another.
In order to provide an estimate of the differential impacts of climate change, research is required to improve our fragmented knowledge and large uncertainties. A global, cross-sectoral, quantitative synthesis of climate impacts, including consistent estimates of uncertainties, is missing so far.
Furthermore, a better, quantitative understanding of impacts will enable the derivation of efficient impact emulators, which can in turn be employed to enhance integrated assessment studies.
People
Joshua Elliott | Ian Foster | Michael Glotter | Neil Best | David Kelly
Publications
The allocation of the world’s land resources over the course of the coming century has become a pressing research question. Continuing population increases, improving, land-intensive diets among the poorest populations in the world, increasing production of biofuels and rapid urbanization in developing countries are all competing for land even as the world looks to land resources to supply more environmental services. The latter include biodiversity and natural lands, as well as forests and grasslands devoted to carbon sequestration. And all of this is taking place in the context of faster than expected climate change which is altering the biophysical environment for land-related activities. This combination of intense competition for land, coupled with highly uncertain future productivities and valuations of environmental services, gives rise to a significant problem of decision making under uncertainty. The issue is compounded by the inherent irreversibility of many land use decisions.
The goal of this study is to determine the optimal profile for global land use in the context of growing commercial demands for food and forest products, increasing non-market demands for ecosystem services, and more stringent greenhouse gas (GHG) mitigation targets. We do so by developing a new model, nick-named FABLE: forest, agriculture, and biofuels in a land use model with environmental services. This model determines the optimal allocation of scarce land, both across competing uses as well as across time. While market failures, including ill-defined property rights, poorly developed land markets, lack of information, and credit constraints preclude such a path from being achieved in reality, this optimal path is a useful point of reference for those seeking to influence patterns of global land use. The resulting long-run, forward-looking, computable partial equilibrium model, covers key sectors drawing on the world’s land resources, and incorporates growing demands for food, renewable energy, and forest products, as well as non-market demands for ecosystem services. We also consider alternative GHG constraints, as well as the potential impacts of climate change itself on the productivity of land in agriculture, forestry and ecosystem services.
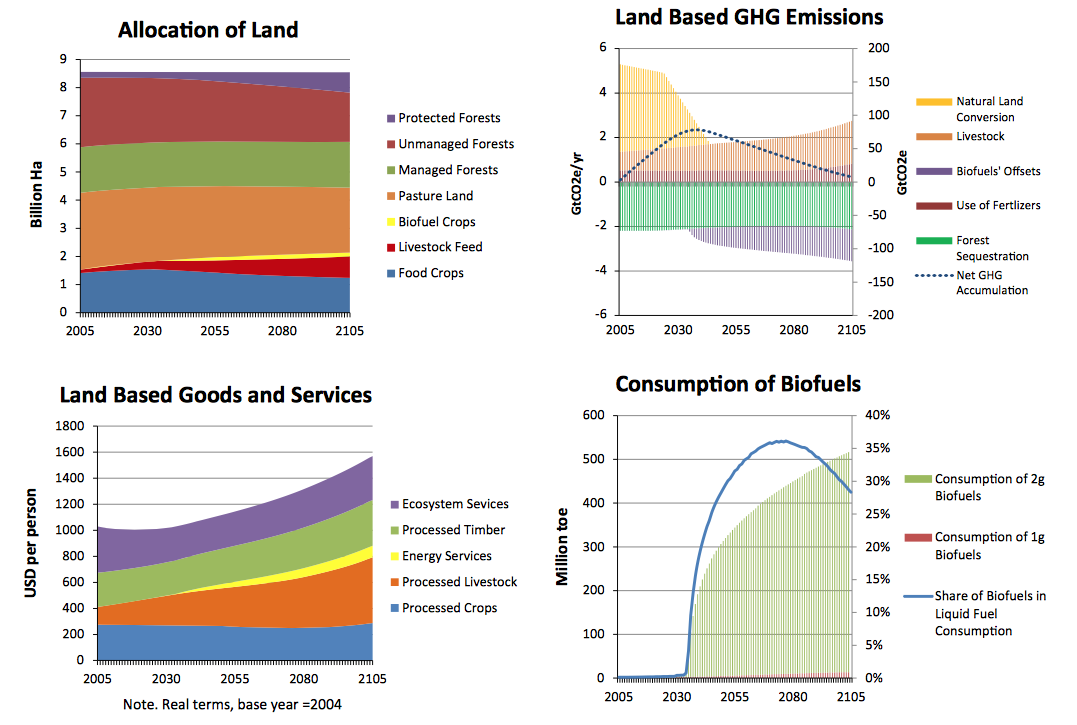
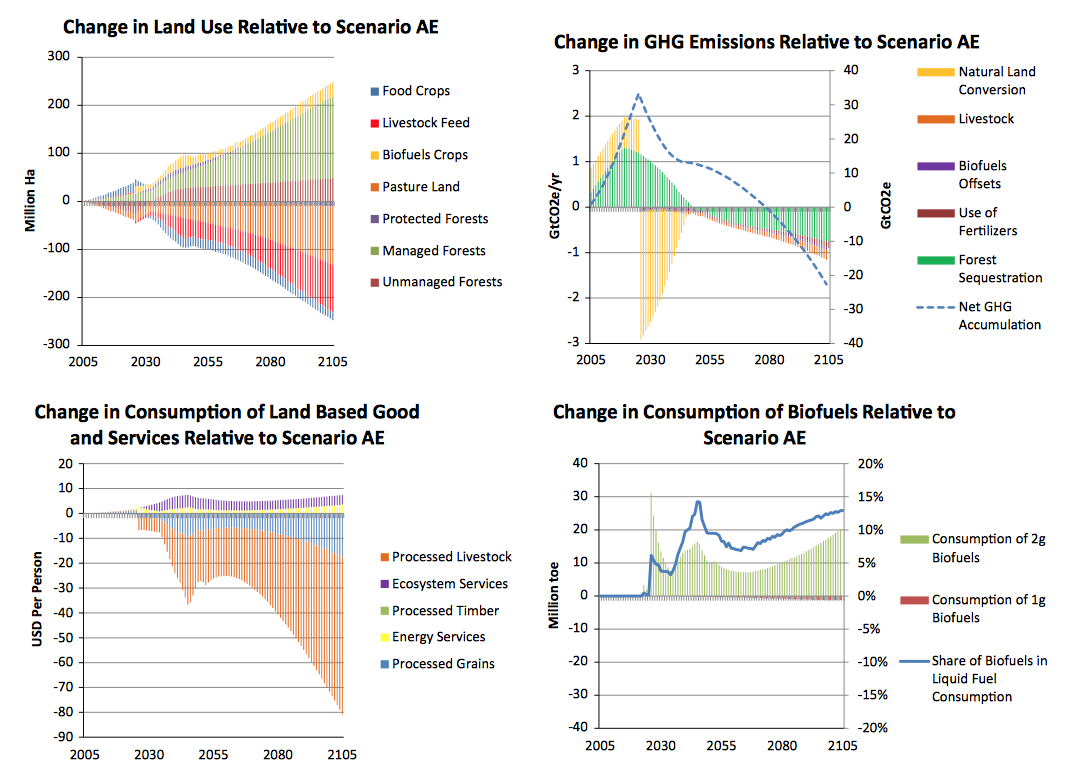
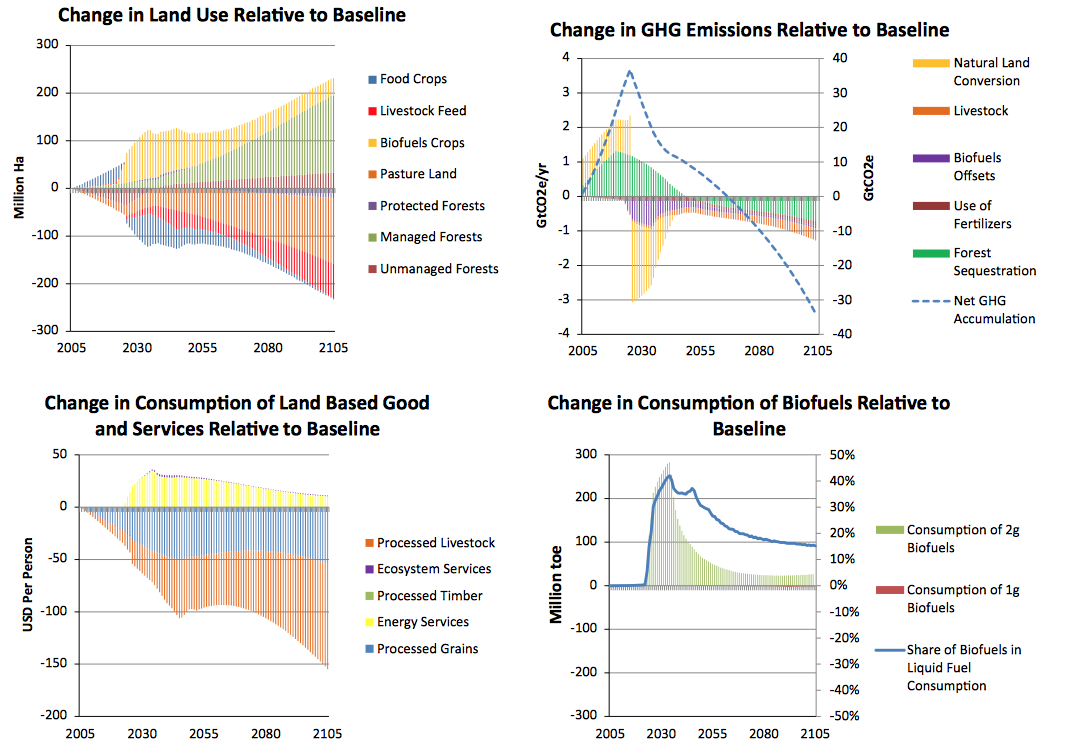
Our baseline reflects developments in global land use over the 10 years that have already transpired, while also incorporating long-run projections of population, income and demand growth from a variety of international agencies. The model baseline suggests that, even in the absence of GHG regulations, deforestation rates associated with cropland expansion decline along the optimal land-use trajectory in the medium term. This is important, since deforestation accounts for a large share of current global GHG emissions. In the long term there is a significant expansion of the livestock sector, driven by increasing per capita incomes, and this is fueled by increasingly intensive production practices. The area of protected natural lands, which deliver valuable ecosystem services, also increases strongly in the long run. However, this finding is sensitive to the choice of social discount rate. A higher rate of discount results in a sacrifice of forest cover and ecosystem services in favor of more immediate delivery of services from food and energy consumption. Along the baseline, the consumption of biofuels increases rapidly after second generation biofuels become commercially viable in 2035, and provides for about a third of total liquid fuel consumption by the end of this century, along the optimal path under our baseline scenario.
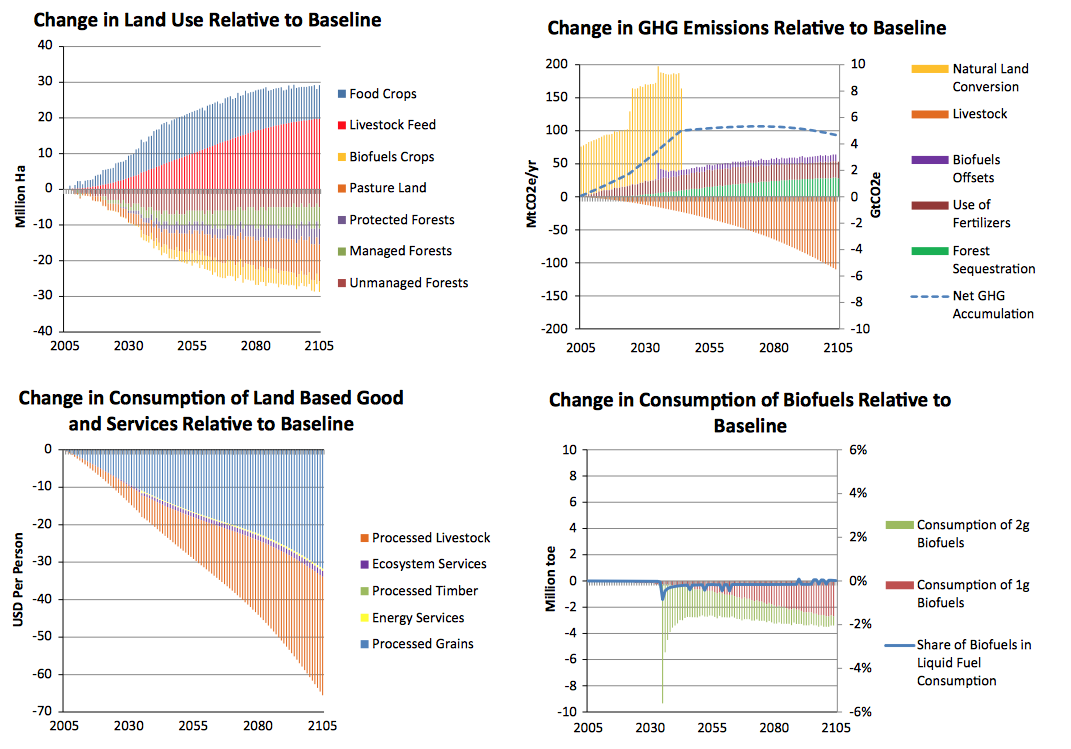
We consider three counterfactual scenarios aimed at capturing the most important sources of uncertainty associated with this long run trajectory for global land use, climate impacts on agriculture, energy prices, and global GHG emissions regulations.
Adverse climate impacts on crop yields curtail food production, requiring additional cropland and encouraging additional fertilizer use, thereby leading to higher GHG emissions.
Energy prices affect the optimal deforestation rate as well as the overall amount of land used in agriculture.
By mid-century, cropland area increases sharply under higher energy prices, due to the incentive for increased biofuel production as well as higher fertilizer prices which raise the cost of intensification.
Substantially more deforestation occurs under this scenario and the increased GHG emissions from land use change outweigh the emissions fall from displacement of petroleum consumption by biofuels and declining fertilizer use.
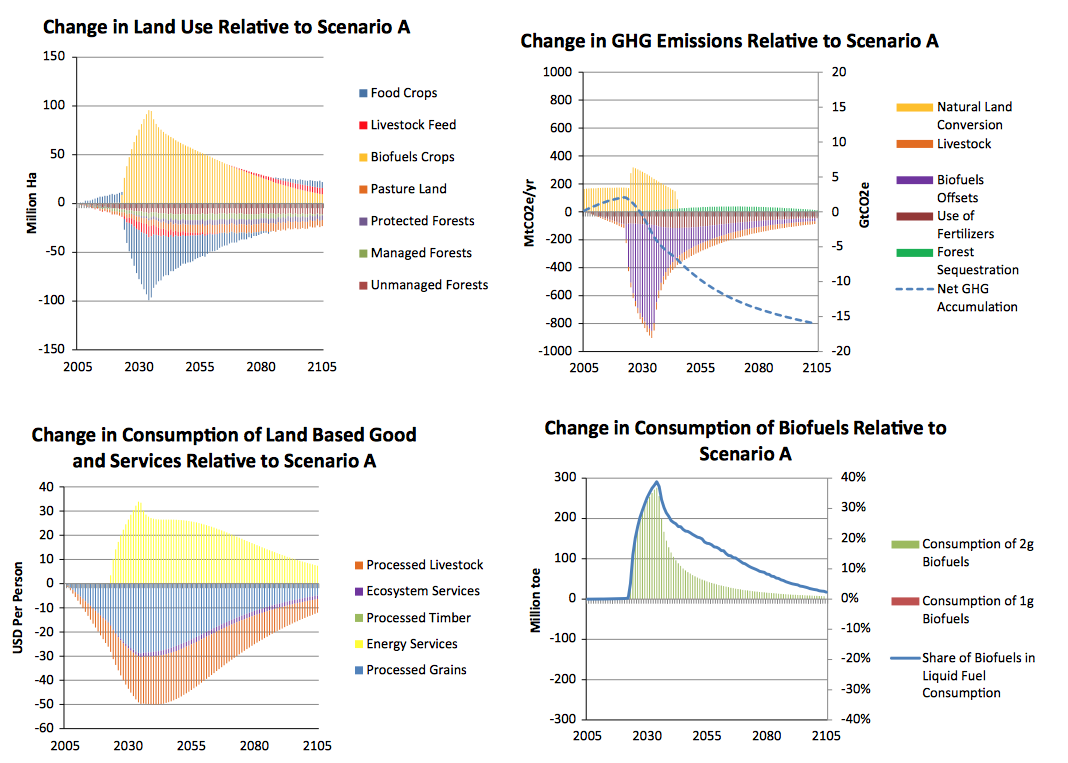
When we also require the world’s land base to deliver land-based GHG abatement, the pressure on global natural land resources becomes even more significant.
While the introduction of the land based GHG emissions constraint leads to a significant reduction in GHG emission flows over the twentyfirst century, its effectiveness is eroded by a substantial increase in GHG emissions after the policy is announced, but before the policy is actually implemented.
This mimics the ‘green paradox’ found in other areas of environmental regulation. Since such pre- announcement seems inevitable from a political-economic perspective, it is an issue which deserves greater attention. Indeed, we find a leakage rate of 56%, which is very high and threatens to undo most of the GHG mitigation benefits of such a policy.
When all three ‘scenarios’ are simultaneously realized, the world’s land resources face a ‘perfect storm’ in which the cost of agricultural intensification is higher, biofuels expand their area, additional cropland is needed to offset the adverse impacts of climate change, and climate regulation also places new pressures on land availability for food. In this case the optimal path of food consumption is significantly lower, highlighting the potential for intense competition for land in the production of the world’s food, fuel and environmental services over the twentyfirst century.
Jevgenijs Steinbuks | Thomas W. Hertel